Methods - Data Collection
|
Site Selection
I have been working closely with Environment and Climate Change Canada (ECCC) to implement the High Elevation Monitoring Program (HEMP) in the Yukon Territory, and will be using data from this program for my research.
We selected ten mountains across Southern Yukon accessible by hiking trail into the alpine and located near Whitehorse, Yukon (Figure 6). |

|

|
Mountains were divided into four bioclimate zones (Boreal Low (L), Boreal High (H), Subalpine (S), and Alpine Tundra (T)) based on Government of Yukon Bioclimate Mapping (2021) and NASA ABoVE landcover (Figure 7). This study will use only data from the subalpine and alpine bioclimate zones. We then randomly selected 3-5 spatially-balanced secondary sampling units (SSUs) per bioclimate zone (Figure 2) for a total of 71 sampling sites across ten mountains. These SSU sites were used to gather bird vocalization data and vegetation data for this research. |
Bird Data
We used autonomous recording units (ARUs) to record bird vocalizations from mid-May to end-August 2021 (Figure 8). These units recorded soundscapes for five minutes every 15 minutes from 03:00 to 09:00 during the dawn chorus when birds are typically vocalizing more frequently. According to ECCC transcription standards, we randomly selected six five-minute recordings per SSU and identified the bird species and abundance of each species vocalizing on those recordings through manual listening techniques. I summed the abundance of each species and used this as an estimate of each bird species abundance at each sampling site.

|

|

|
Figure 8: Examples of autonomous recording units (ARUs) deployed in subalpine (B) and alpine (A, C) habitats. We used SM Minis from Wildlife Acoustics (A, C) and BarLTs from Frontier Labs (B).
Vegetation Data
|
We gathered vegetation data at each subalpine and alpine SSU during 2022. We characterized shrubs into four categories based on height: tall, medium, low, or very low (Table 1). At each SSU we:
|

Table 1: Shrub height classifications (B.C. Ministry of Forests, 1998)
|
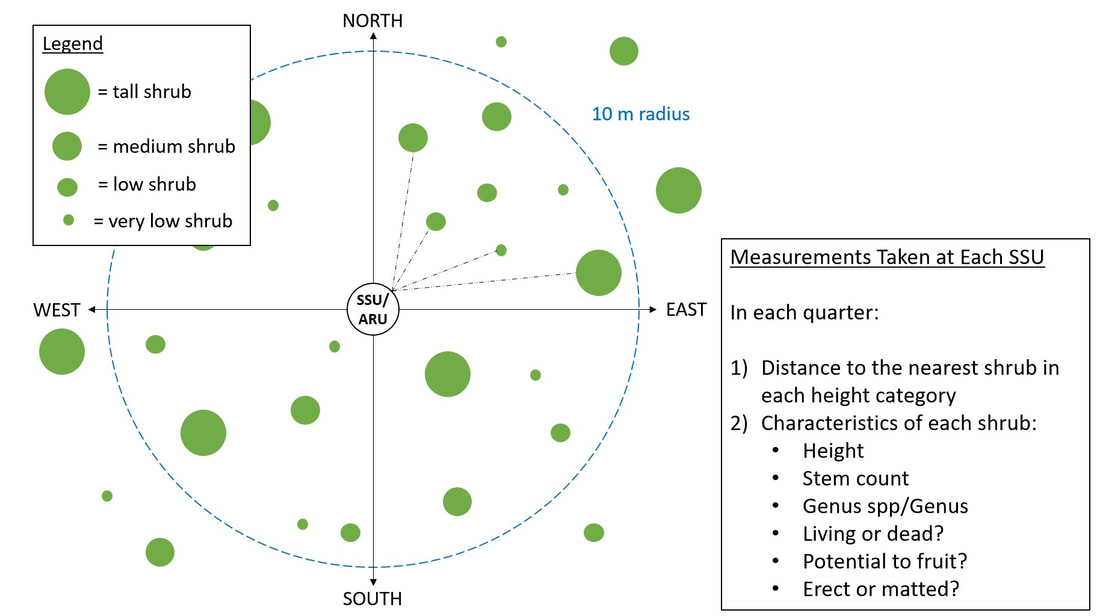
Figure 9: Pictogram depicting the vegetation measurements taken at each SSU (top view). The measurements to the nearest shrub of each height category in each quarter are averaged to estimate density of shrubs using the Point Centre Quarter Method.
Methods - Data Visualization and Analysis
Data were visualized and analyzed in RStudio (v2022.12.0.353) using R Statistical Software (v4.2.2; R Core Team, 2022).
For the purposes of this project, my intended predictor variables are the three elements of shrub dominance (shrub height, density, and stem count) and shrub species and the response variables are estimated bird abundances. I used nonmetric multidimensional scaling (NMDS) with two dimensions to simplify and visualize the bird vocalization and vegetation data separately. I used non-scaled Bray-Curtis distances for the bird vocalization data and non-scaled Euclidean distances for the vegetation data. Finally, I used direct and indirect gradient analyses to examine the relationships between estimated bird abundance and elements of shrub dominance and shrub species.
For the purposes of this project, my intended predictor variables are the three elements of shrub dominance (shrub height, density, and stem count) and shrub species and the response variables are estimated bird abundances. I used nonmetric multidimensional scaling (NMDS) with two dimensions to simplify and visualize the bird vocalization and vegetation data separately. I used non-scaled Bray-Curtis distances for the bird vocalization data and non-scaled Euclidean distances for the vegetation data. Finally, I used direct and indirect gradient analyses to examine the relationships between estimated bird abundance and elements of shrub dominance and shrub species.
